
Data and Society Grades 9 to 12
Plan, run, clean, graph and model a community survey by hand, and learn how data can help or harm the people in it.
Free, start to finish. No card. Every week opens without signing in.
- Grade
- Grades 9 to 12
- Length
- 12 weeks
- Pace
- 6 short lessons a week, about 20 minutes each
- Price
- Free, every week
About this course
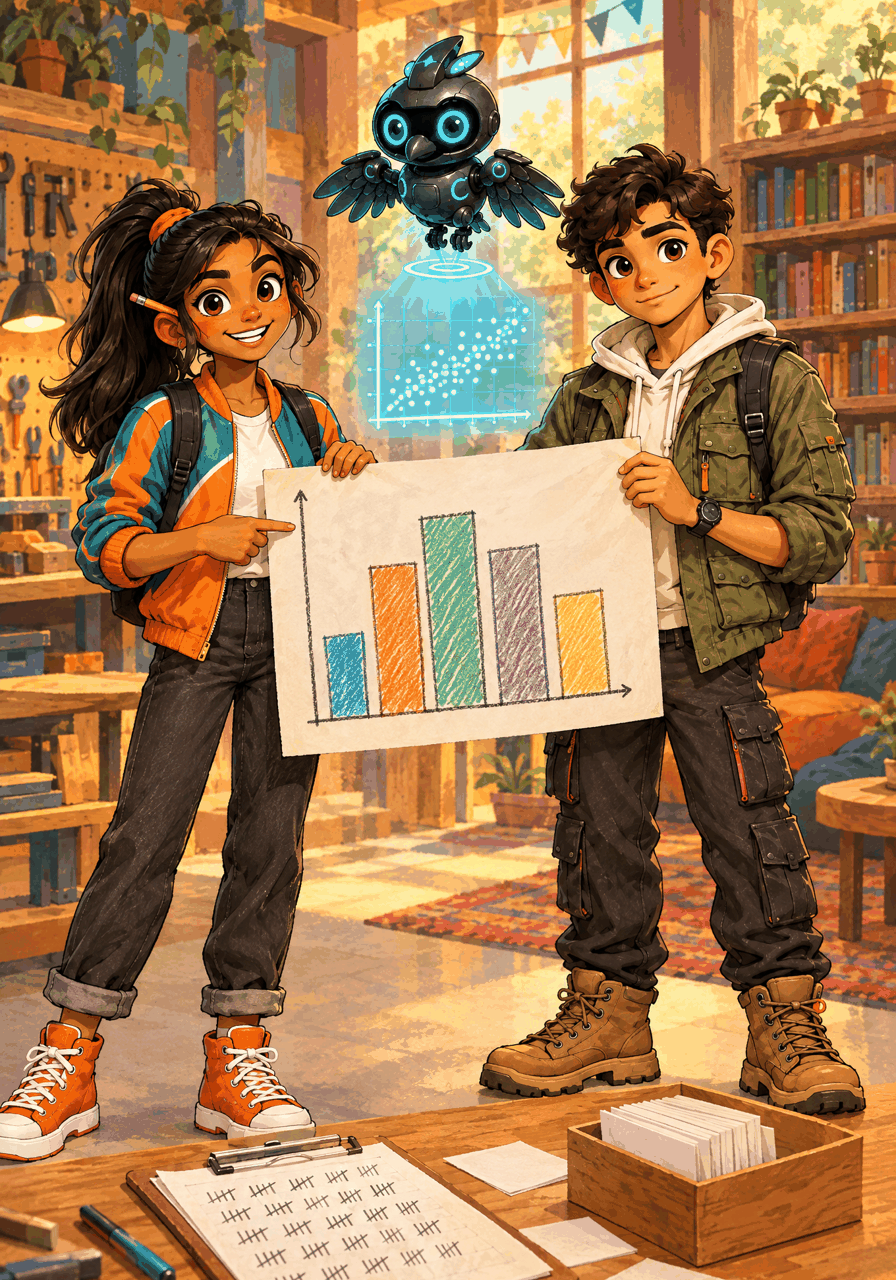
Data and Society Grades 9 to 12 is a 12-week course on how data is collected, stored, cleaned, pictured, analyzed and shared, and what that means for the people behind it. Students follow Commons Count, the crew's survey of the members of a made-up community maker hall. They turn a big question into one data can answer, ask for consent and collect only what they need, record and code the answers, clean messy data, draw honest graphs and spot misleading ones, find typical values, build a dice simulation, audit for bias and decide who owns the answers before sharing a data story. It covers AP Computer Science Principles Big Ideas 2 and 5 and practices CSTA Level 3A and 3B standards; it is not an AP course and is not affiliated with College Board. Short daily lessons with checked answers, an unplugged Count Lab each week and a Saturday Mission Quest for the family. No accounts, apps or software needed. 100% free, start to finish.
Kids will
- Turn a big question into one that data can fairly answer
- Ask for consent, collect only what is needed and protect privacy
- Record, code, store and clean data without changing what it means
- Draw honest graphs by hand and spot charts that mislead
- Find typical values and test a simple simulation model
- Audit data for bias and decide how to share results responsibly
The 12 weeks
-
Week 1
What Is Data?
From raw facts to information the Commons can act on
-
Week 2
Asking Good Questions
Choosing how to collect data that can fairly answer the question
-
Week 3
Ask First: Consent and Privacy
What the crew never collects, and how it asks before it collects
-
Week 4
Collecting and Recording
One row per member, one column per question
-
Week 5
Storing Data
From answers to codes to bits
-
Week 6
Cleaning Data
Fixing messy data without changing what it means
-
Week 7
Picturing Data
Bars, lines, pies and dots, drawn by hand
-
Week 8
Charts That Mislead
How a true number can tell a false story
-
Week 9
Finding the Middle and the Pattern
Typical values, extreme values and what a pattern can prove
-
Week 10
Models and Simulations
Can a simple model predict what will happen next?
-
Week 11
Bias, Access and Many Voices
Whose voices are in our data, and whose are missing?
-
Week 12
Who Owns the Data?
Sharing what we learned without harming the people in it
More in Code Crew
Try Week 1 today.
Open the course, pick Day 1 and go. Make a free parent account when you want progress saved for each kid.